Sustainability
Sustainability
priorities
Responsibility is integrated into our strategy and operations throughout the value chain.
The entire value chain, from harvesting to final products,
is designed around synergetic and sustainable material flows.
Wood wisdom is at the core of our sustainable business.
Environment and climate
We continuously strive to reduce the impact of our operations on soil, water and climate by developing products and production processes throughout the value chain and product life cycle.
Climate impacts
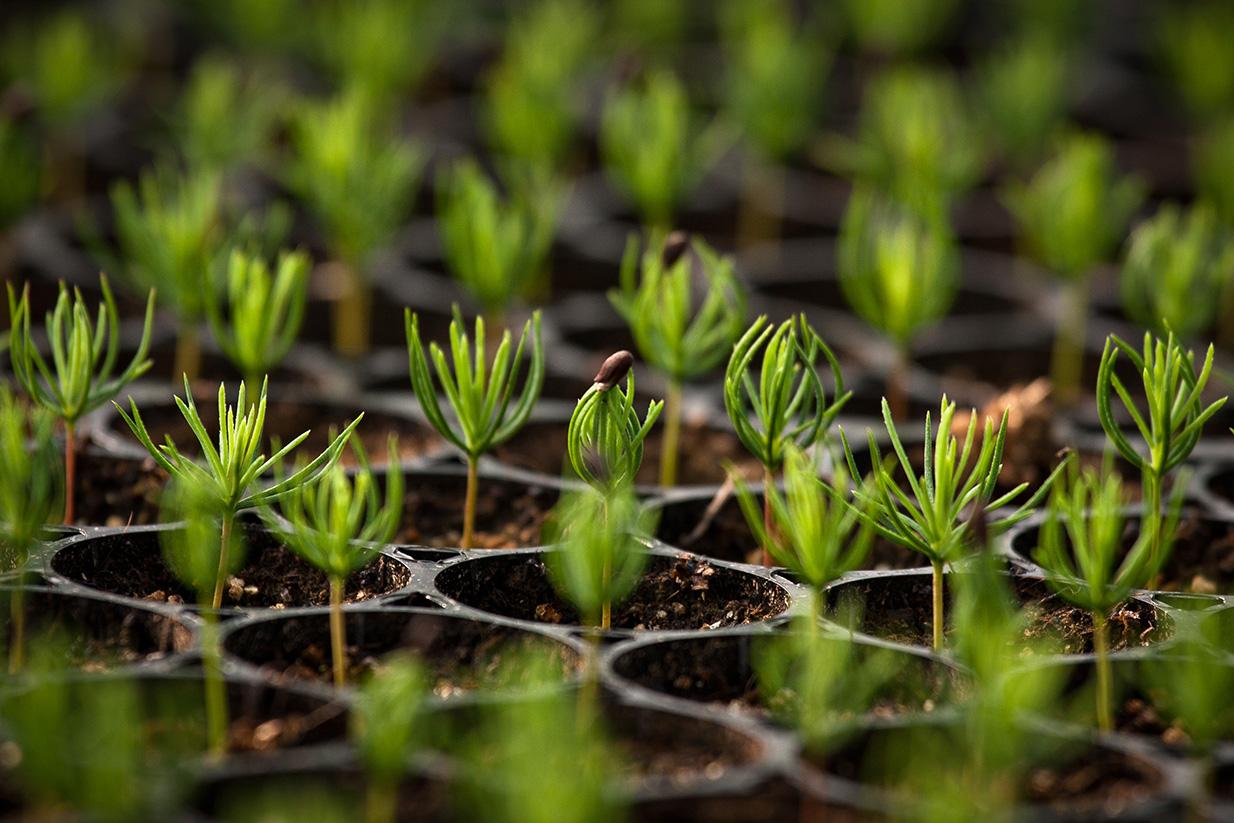
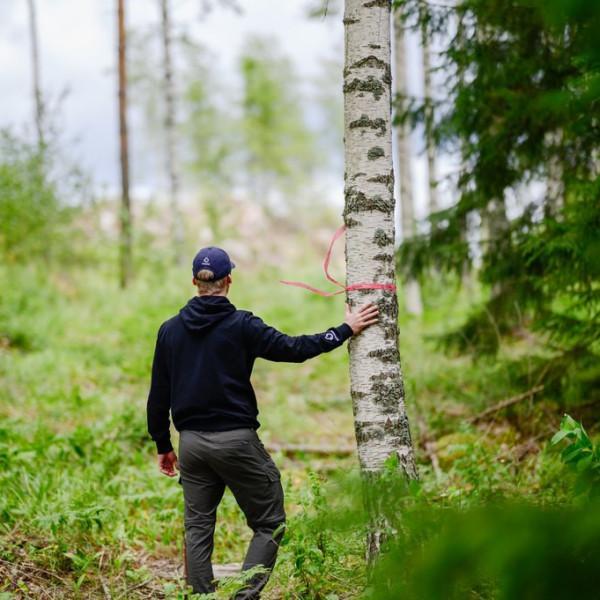
Wood supply and forestry
Material and resource efficiency
Environmental aspects

Certified wood raw material 87% (2024)
3.81 Personnel satisfaction index (2024)
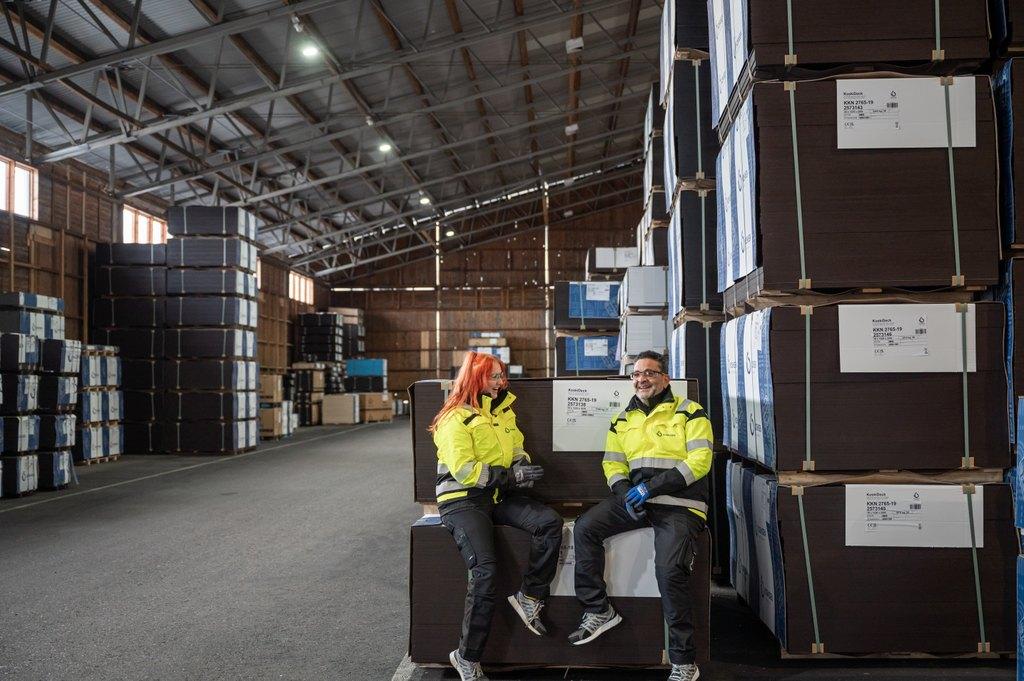
People
For Koskinen as an employer, it is important that employees feel that their workplace is safe and where everyone’s work feels meaningful. The goal is a pleasant, health-promoting and responsible work community.
Responsible employer
Occupational safety and well-being
Training and development
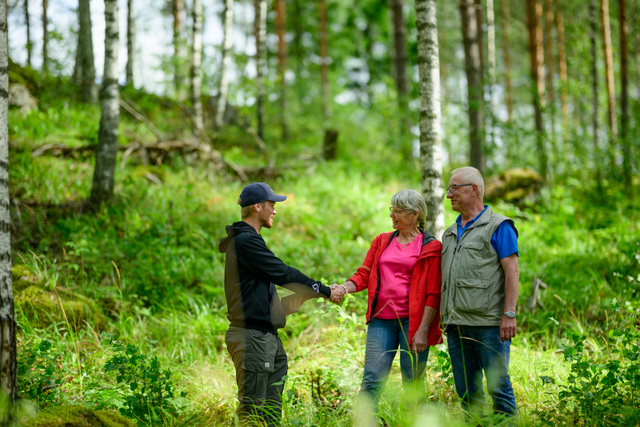
Partners and society
Koskisen has a significant impact on both the financial well-being of its stakeholders and society, both directly and indirectly. The goal is to be a long-term and fair partner for its stakeholders.
Economic impact
Forest owners
Responsible procurement
Communities and networks
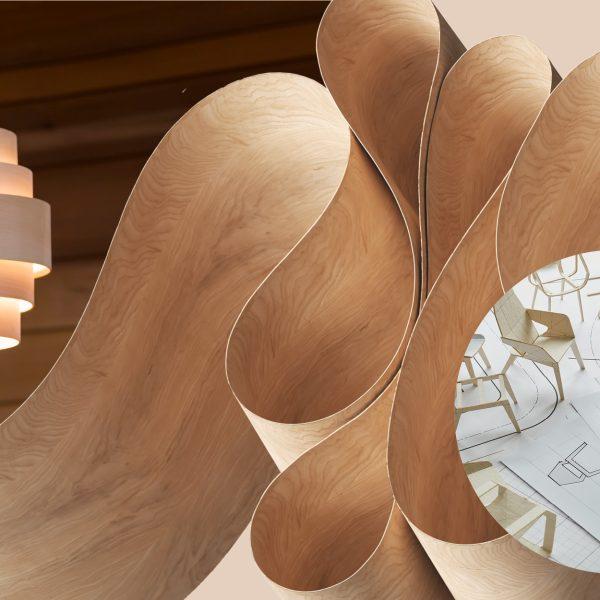
Customers and products
Customer satisfaction NPS 63 (2024)

Sustainability programme
Koskinen’s operations are based on biodiversity-conscious forestry and competent wood sourcing, the processing of wood into bioeconomy products and green transition, and the creation of added value for customers and other stakeholders. We manage responsibility as part of strategy and operational activities in accordance with our values.
Releases
-
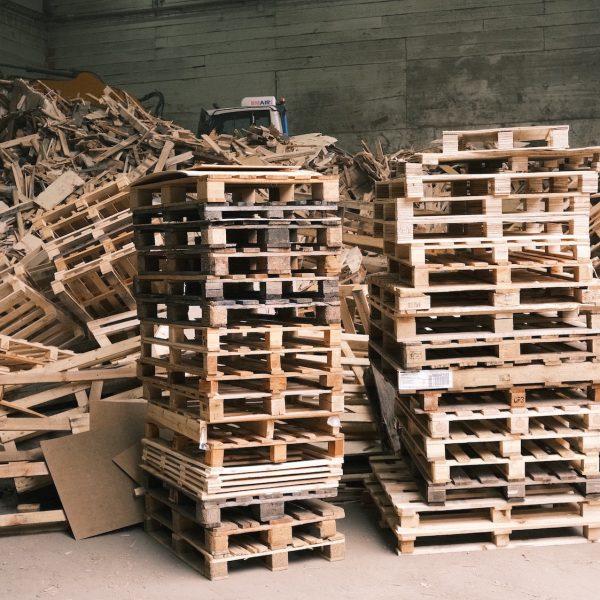
New recycled chipboard developed through Koskisen’s and Kesko’s collaboration – a unique recycled wood cleaning process in Finland
Koskisen Corporation, Press Release, June 4, 2025, at 09:00 a.m. EEST Koskisen, in collaboration with…
-
Koskisen’s new Zero ThinPly receives award for quality, innovation and sustainability
Koskisen Corporation press release, May 20, 2025, at 10:00 a.m. EEST The wood products company…
-
The Zero product family expands with bio-based thin plywood
Koskisen Corporation press release, May 12, 2025, at 11:00 a.m. EEST Koskisen is launching a…
-
Koskisen publishes extensive sustainability programme – key responsibility focus areas support the company’s sustainable growth
Koskisen Corporation press release on 27 June 2024 at 10:00 a.m. EEST The wood products…